
Fundamental Analysis
Using Volume and Open Interest in the Futures Market:
The US30 began an upward correction on Friday accompanied by a decline in volume (from 228,825 to 161,642) and an increase in open interest. These indicators suggest that, although the price is rising, the lower trading volume reflects caution, and positions are being accumulated gradually without strong conviction in the movement’s direction, while market participants await today’s Fed monetary policy meeting.
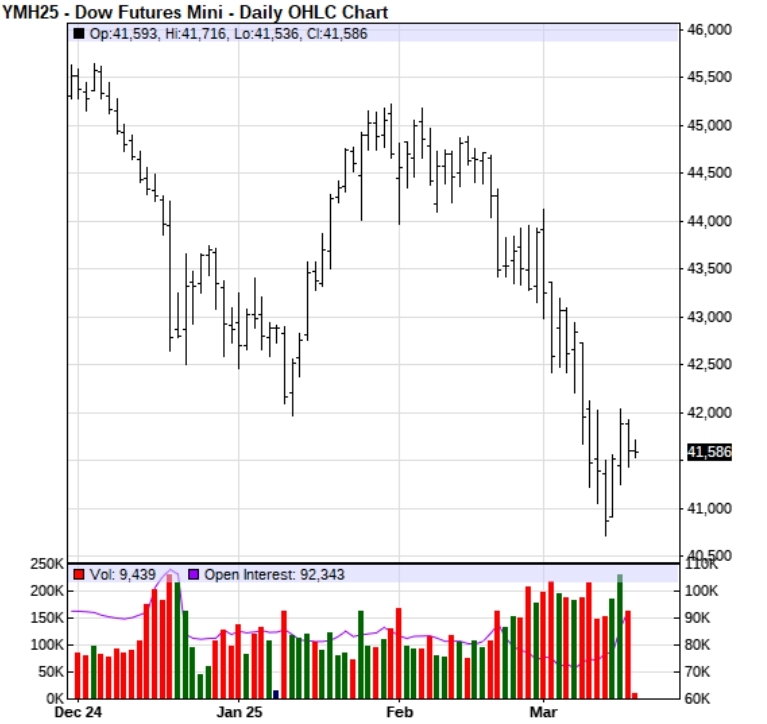
Source: Investing.com
In addition, the COT report reveals that large speculators’ contracts, both long and short, are in negative territory, implying an overall reduction in positions and an uncertain market environment.
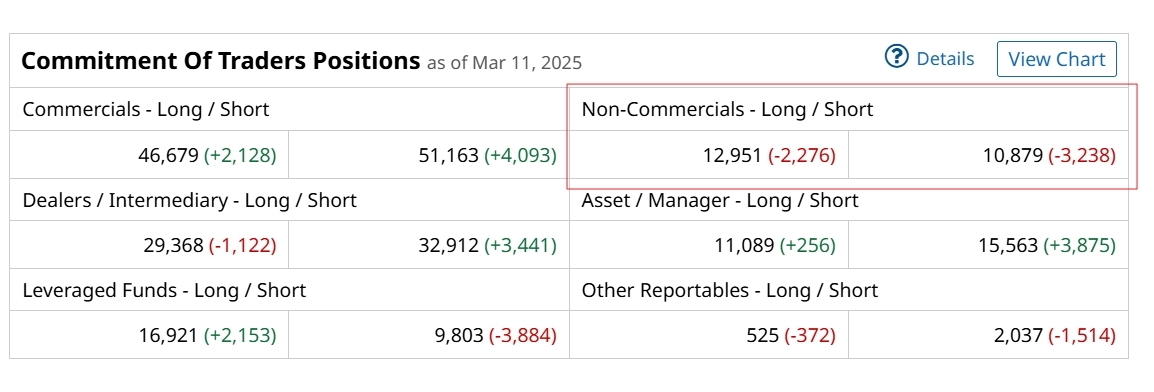
Source: Barchart.com
The outlook will largely depend on the FOMC projections and the dot plot to be released in today’s meeting, where no rate cuts are expected. If the projections indicate at least one rate cut during the year, the monetary stimulus could boost the US30 and favour a rally. Conversely, if the Fed is not expected to cut rates in 2025, the index could continue with sideways or further downward moves toward the August 2024 levels.
Key Takeaways:
• Price Up, Volume Down, Open Interest Up: This pattern indicates a moderate upward correction; the rise in open interest reinforces that positions are being established, which could sustain the bullish move if volume increases are confirmed.
• COT – Reduction in Large Speculators’ Positions: The decline in both long and short positions reflects market caution, potentially translating into lower short-term volatility or a wait for new catalysts to define whether the trend continues.
• Fed Rate Projections: If the dot plot anticipates rate cuts during the year, it is viewed as positive for the US30, as lower rates favour liquidity and market growth. In contrast, if no cuts are projected for 2025, the index might face greater resistance and corrections due to the environment of stable or even higher rates.
Technical Analysis – US30 Daily
- Suply Zones (Bid): 42,667
- Demand Zones (ask): 41,374 / 40,700
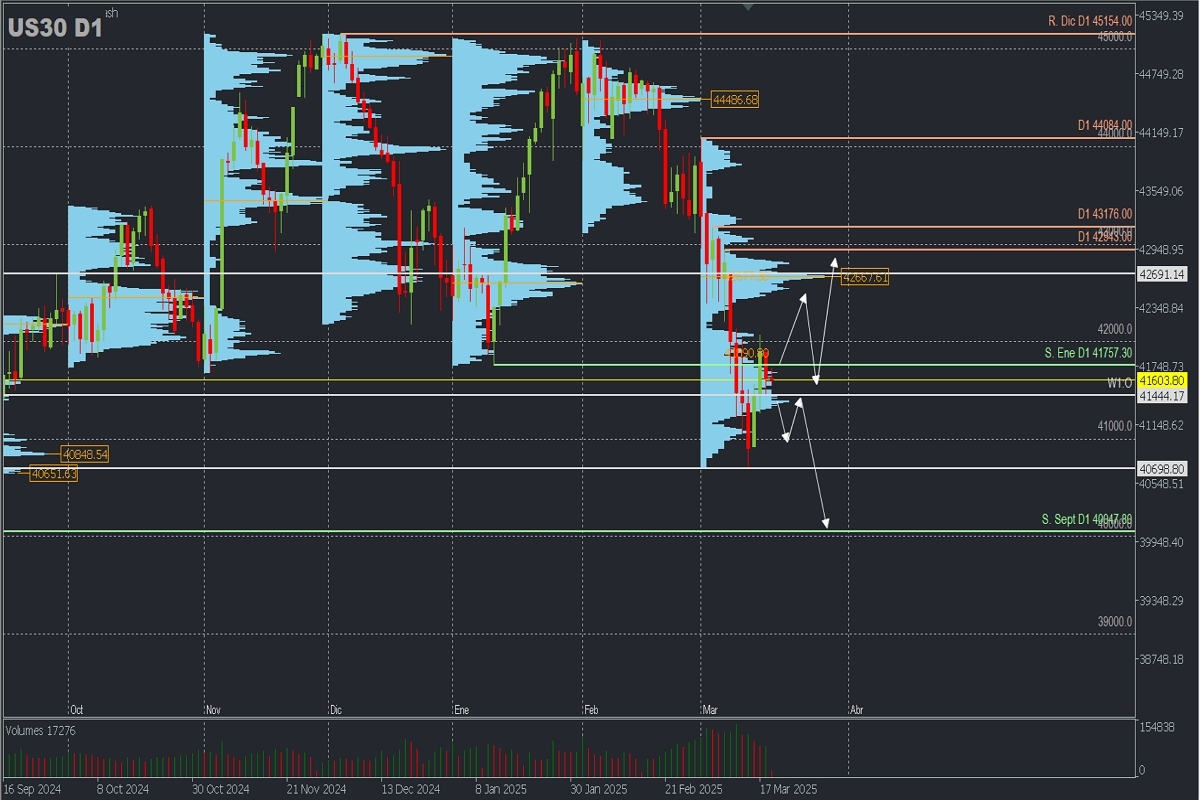
The current downtrend leaves support at 40,698.80, with the last validated daily resistance at 43,000. After reaching a key demand (buy) zone last week (September) between 40,652 and 40,848, the present correction was triggered.
If prices remain above the weekly open (W1:O) at 41,444, the correction could extend above 42,000 toward the last March supply zone around 42,667—which coincides with the annual open—a zone expected to be defended by bears for a further drop toward the September support at 40,000.
However, if the price fails to set a new low below the current support at 40,698, attention will be paid to sustained bullish reversal signals and the subsequent break of the key resistance mentioned above.
Monitoring the H4 chart, which will reveal the intraday trend, is also recommended.
Technical Summary:
- Bullish Scenario: Buys above 41,600 and 41,924 with targets at 42,100, 42,300, and 42,400 in extension.
- Bearish Scenario: Sells below 41,500 with targets at 41,250; a decisive break will signal a continuation to 40,700, 40,500, and 40,000 in extension.
Uncovered POC: Point of Control (POC) is the level or zone where the highest volume concentration occurred. If a downward move followed from that level, it is considered a sell zone and forms a resistance area. Conversely, if an upward impulse occurred from that level, it is considered a buy zone, usually situated at lows, and thus forms support areas.


