Introduction
Understanding trading candlestick patterns is invaluable in revealing market dynamics. One such important pattern is the Dragonfly Doji, a potent indicator that usually suggests a bullish reversal. Mastering this pattern gives a trader higher precision in decision making and harnesses available trading opportunities.
What is a Dragonfly Doji?
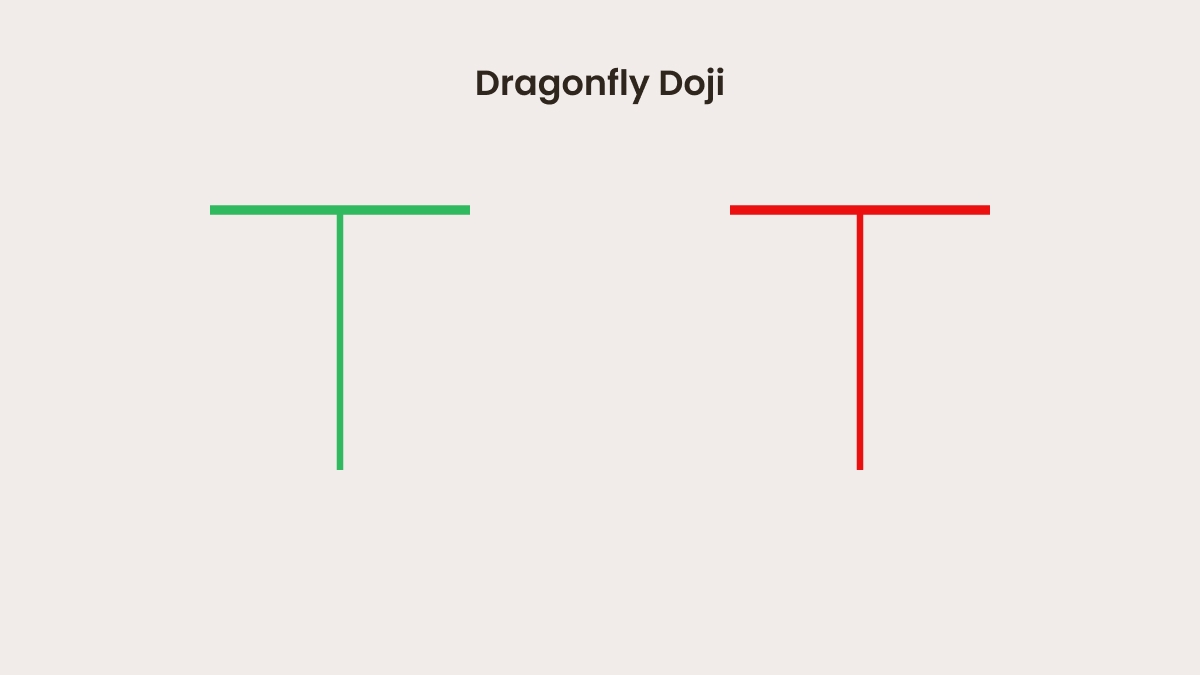
The Dragonfly Doji is an uncommon candlestick pattern with an extended lower shadow, little or no body, and no upper shadow. It appears as the letter T and emphasizes a vital stage for the market, when prices mount a massive recovery shortly before the last price point.
Key characteristics:
Opening and closing prices: The same or nearly identical.
Lowest price: Significantly below the opening and closing levels.
Highest price: Equal to the opening and closing levels.
What does the Dragonfly Doji Indicate?
Buyer strength: Initially, sellers dominate, pushing the price downward. However, buyers regain control, pushing prices back to the opening level.
Market indecision: The pattern suggests a tug-of-war between buyers and sellers, resolving in the buyers’ favor.
Bullish reversal signal: Typically, this pattern appears at the end of a downtrend, hinting at a potential upward price movement.
Conditions for a valid Dragonfly Doji pattern
To maximize the predictive power of the Dragonfly Doji, specific conditions must be met:
Support levels: The pattern should form near a strong support zone or in oversold market conditions.
Trading volume: High trading volume during the formation of this pattern confirms buyer interest.
Timeframes: It is most reliable on daily and weekly charts, where market noise is minimized.
How to use the Dragonfly Doji in trading
1. Entry point identification
Wait for confirmation: A bullish candle closing above the high of the Dragonfly Doji validates the reversal.
Enter long positions once confirmation occurs.
2. Setting stop-loss and take-profit Levels
Stop-loss: Place it slightly below the low of the Dragonfly Doji.
Take-profit: Aim for the nearest resistance level or use a risk-reward ratio of 1:2 or 1:3.
Limitations and risks
While the Dragonfly Doji is a powerful tool, it is not foolproof. Understanding its limitations helps mitigate potential losses:
Potential false signals: The pattern may lead to incorrect trading decisions without additional confirmation.
Context sensitivity: It works best with tools like moving averages, RSI, and Fibonacci retracement levels.
Timeframe considerations: Lower timeframes may yield unreliable patterns due to market noise.
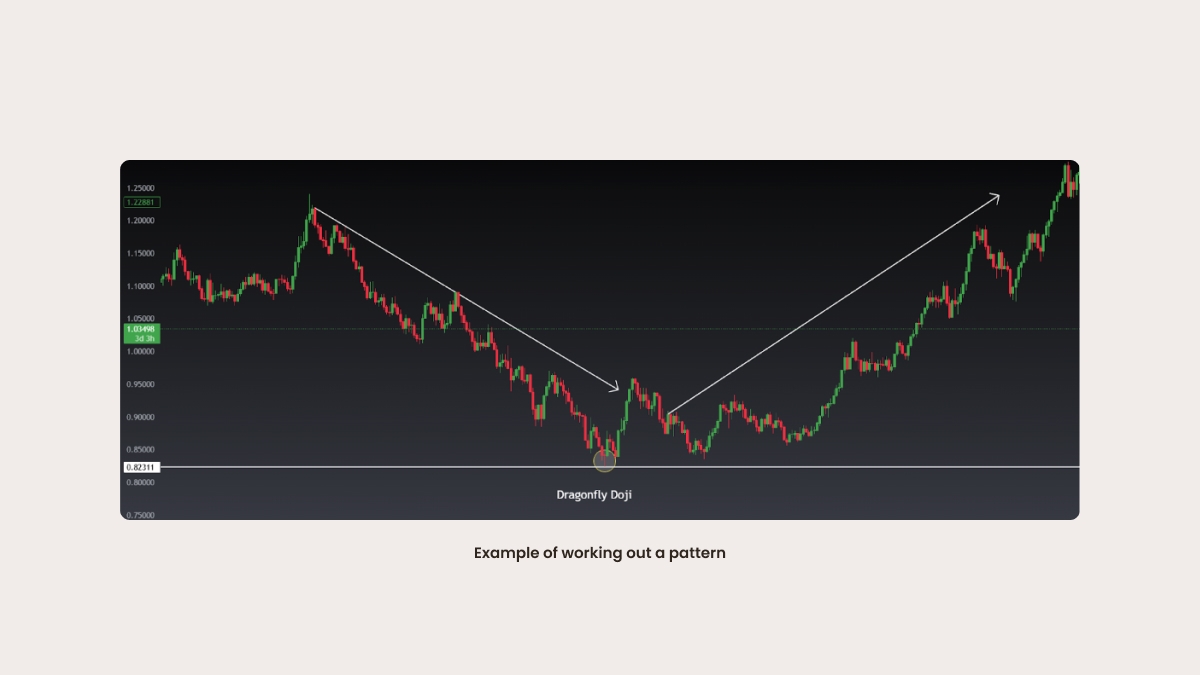
Practical example
Imagine a stock that has been in a steady downtrend. At a key support level, a Dragonfly Doji forms with increased trading volume. The next candle closes higher, confirming the reversal. A trader could then enter a long position with a stop-loss slightly below the Doji’s low and set a take-profit at the next resistance level.
Summary
The Dragonfly Doji is a valuable pattern for traders seeking to identify bullish reversals. By understanding its characteristics, conditions, and limitations, traders can enhance their strategies and improve market timing. However, as with any trading tool, confirmation from other indicators and market analysis is essential.